
Immigration policy is one of the most divisive topics being discussed in recent months. Conservatives, liberals, and those without labels, find themselves echoing rhetoric that is often without historical context. Without first understanding the past, one struggles to find a basis for a political position, let alone a solution.
The U.S. was not founded by immigrants, yet by settlers. Settlers left Europe with the intent to colonize and create a community from the ground up. This took the form of both establishing permanent colonies on uninhabited land, along with displacing the native population. They came to build a new society, not to integrate into one that already existed.
Immigration is when a people move to an existing society, generally with the understanding that some form of cultural and social adaptations will be made. Assimilation and integration are two related but different frameworks that seek to balance the concept of a united melting pot – E pluribus unum, and a respect for cultural heritage. Assimilation vs integration is a conversation that comes after looking at historical immigration data.
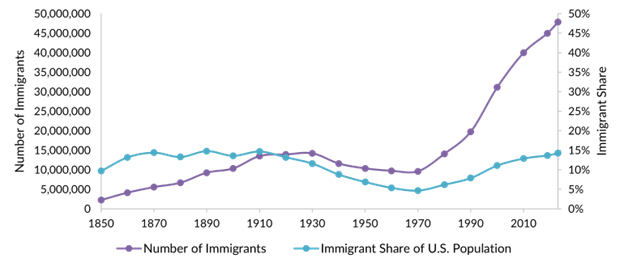
In the years after the initial settlers founded communities, immigration began in earnest in the late 1800’s and early 1900’s. Millions looked to start new lives, with the share of the U.S. population being comprised of 15% immigrants for many decades. During the Great Depression and World War II, as a result of challenging economic conditions and an unfavorable political environment, immigration declined, with the number of immigrants in the U.S. as a percent of the population dropping nearly two thirds (see chart).
The Immigration and Nationality Act of 1965, signed into law by President Lyndon B. Johnson would have profound impacts on immigration policy that continue to this day. The law, known as the Hart-Celler Act for its congressional sponsors, repealed national-origin quotas which historically sought to limit immigrants from Asia, Africa, the Middle East, and Southern and Eastern Europe, in favor of those from Western and Northern European countries. The new Act abolished the national-origins quota system and was replaced with a preference system based on immigrants’ family relationships with U.S. citizens or legal permanent residents.
“The bill that we sign today is not a revolutionary bill,” President Johnson said during the signing ceremony. “It does not affect the lives of millions. It will not reshape the structure of our daily lives, or really add importantly to either our wealth or our power.” Senator Ted Kennedy, the bill’s floor manager, stated: “It will not upset the ethnic mix of our society.”
Despite these predictions, the measure had a profound effect on the flow of immigrants to the United States, with the number of immigrants increasing tremendously and in only a matter of years began to transform the U.S. demographic profile.
The original bill provided a preference for immigrants with needed skills and education, but a group of influential congressmen (conservatives allied with the Democratic chairman of the House immigration subcommittee) forced a concession to prioritize admission of immigrants with family members already in the United States, believing it would better preserve the country’s predominantly Anglo-Saxon, European base.
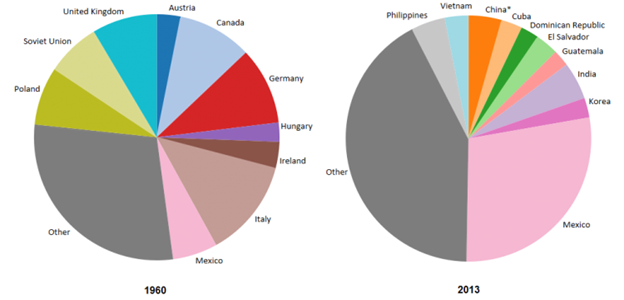
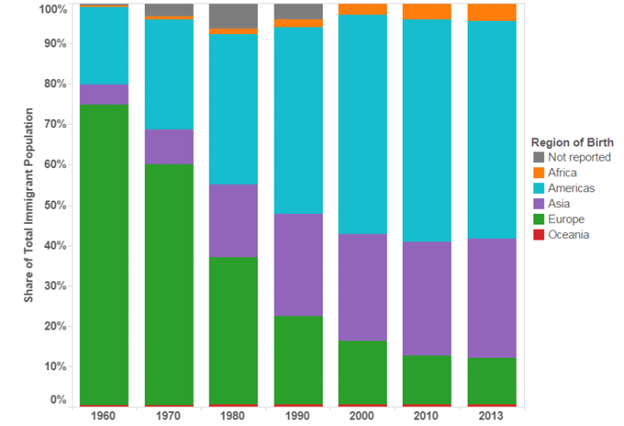
Once again, despite congressmen’s expectations, immigration from Europe slowed. European migrants were replaced with new and well-educated immigrants from across Asia and Latin America, which became the foothold for subsequent immigration by their family networks. Compared to almost entirely European immigration under the national-origins system, flows since 1965 have been more than half Latin American and one-quarter Asian (see charts).
The law dramatically altered the racial and ethnic makeup of the United States. In 1965, whites of European descent comprised 84% of the U.S. population, while Hispanics accounted for 4% and Asians for less than 1%. In 2015, just 50 years later, 62% of the U.S. population is white, 18% is Hispanic, and 6% is Asian.
At the same time as Hart-Celler was being enacted, the Bracero Program was ending, which inadvertently laid the foundation for the steep rise in illegal immigration. The Bracero program was a bilateral agreement between the U.S. and Mexico that ran from 1942 to 1964, allowing Mexican men to work legally in the United States, primarily in agricultural jobs to address wartime labor shortages. The program promised fair wages and housing, but in practice often involved the exploitation of many workers. Over 4.5 million contracts were issued over the course of the program. When the program ended, many former Bracero workers continued crossing the border to fill the same jobs, yet now did so illegally.
Legal and illegal immigrants now make up a considerable portion of the U.S. population. Worldwide, the United States is home to more immigrants than any other country, and more than the next four countries—Germany, Saudi Arabia, the United Kingdom, and France—combined. While the United States represented about 4% of the total global population in 2024, 17% of all international migrants resided in the United States.
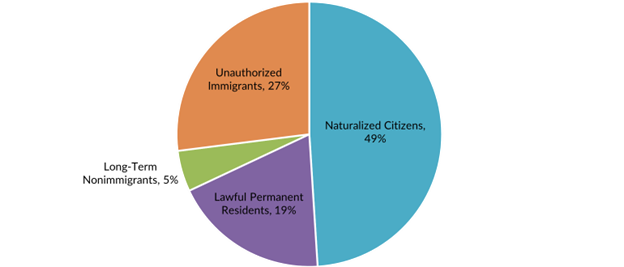
According to the latest American Community Survey (ACS) from the U.S. Census Bureau, there were 47.8 million immigrants residing in the United States as of 2023, with nearly three-quarters in the country legally as naturalized citizens, legal permanent residents (LPRs, also known as green-card holders), or holders of temporary visas. (See chart)
In general, the requirements for naturalization are being at least 18 years of age, passing English and civic exams, and residing in the United States with LPR status continuously for at least five years (three years for those married to a U.S. citizen). From a historical perspective, the number of annual naturalizations has increased dramatically in recent decades. On average, fewer than 115,000 LPRs became citizens each year between 1950 and 1969, doubling to 210,000 in the 1980s, and rising to about 730,000 between 2010 and 2019. Naturalizations reached an all-time high of 1,047,000 in 2008, as a result of impending application fee increases and the promotion of U.S. citizenship, with levels remaining near 800,000 since then. Close to 25 million immigrants were naturalized U.S. citizens as of 2023, accounting for 7% of the total U.S. population (334.9 million).
Looking briefly through the past few centuries, one can see that the topic of immigration and its divisiveness is not a new concept. While the U.S. was found by settlers, immigration has grown to become an important part of our history, not absent from political ideology, and I imagine will continue to remain so.
To be continued – U.S. Immigration: Part Two – Visas, Illegal Immigration, & DACA
Chart Source: https://www.migrationpolicy.org/